ECG Electrolyte Changes: Quick Visual Clues for Calcium and Potassium Imbalances
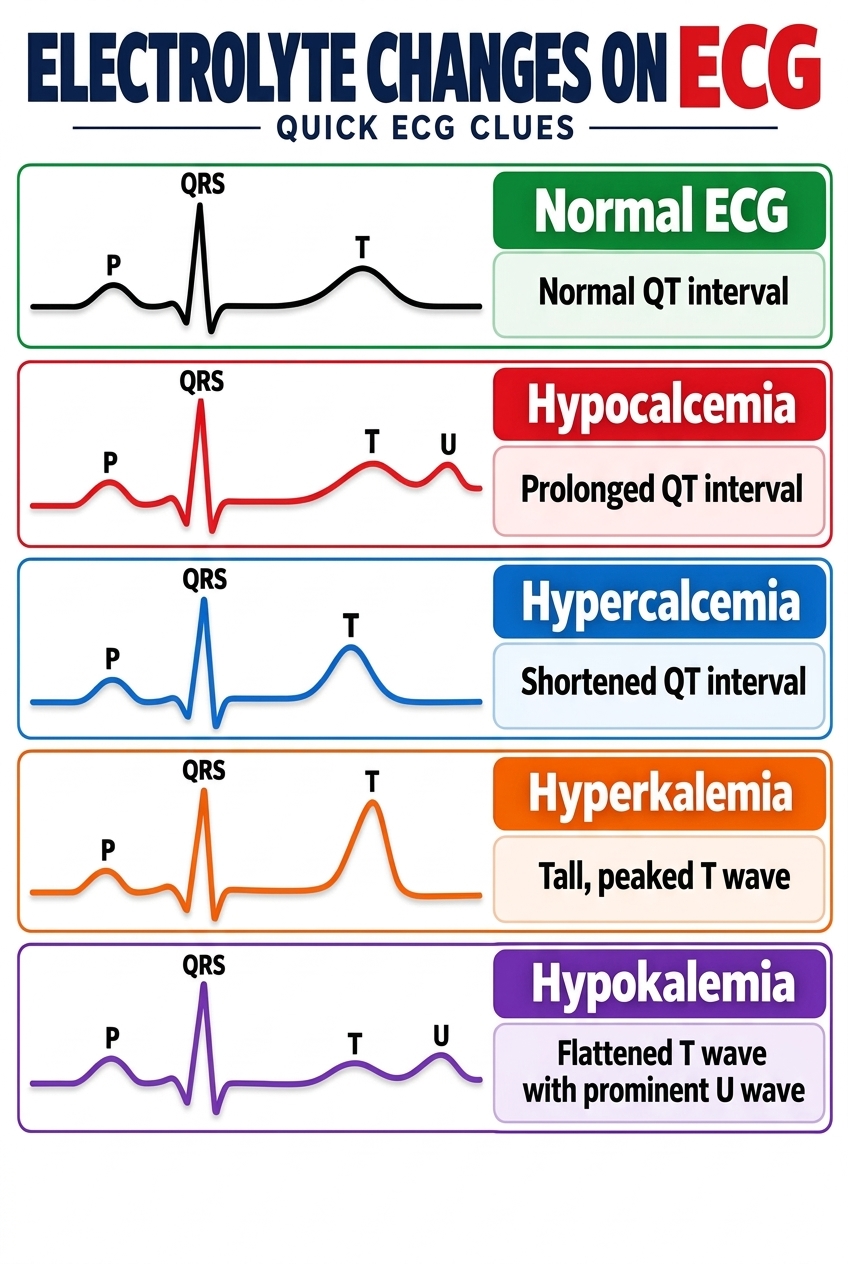
Electrolyte imbalances can silently disrupt the heart’s electrical system, making the electrocardiogram (ECG) an invaluable diagnostic tool for catching these abnormalities early. As this quick ECG clues guide illustrates, specific changes in the waveform—particularly the QT interval and the T wave—can point directly to underlying metabolic disturbances. For instance, a prolonged QT interval is a classic hallmark of Hypocalcemia, whereas a shortened QT interval strongly suggests Hypercalcemia. Recognizing these distinct variations from a normal ECG is a crucial skill for nurses, medical students, and clinicians, as prompt identification can prevent life-threatening arrhythmias.
Potassium imbalances present equally distinctive patterns on the ECG tracing. Hyperkalemia is notoriously characterized by tall, peaked T waves, a dangerous sign that requires immediate intervention to prevent cardiac arrest. Conversely, Hypokalemia typically presents with flattened T waves and a prominent U wave. By familiarizing yourself with these visual “fingerprints,” you can rapidly correlate a patient’s cardiac rhythm with their lab values. This visual reference serves as an essential study aid and a practical clinical companion for interpreting complex ECGs and confirming electrolyte panels.
Leave a Reply