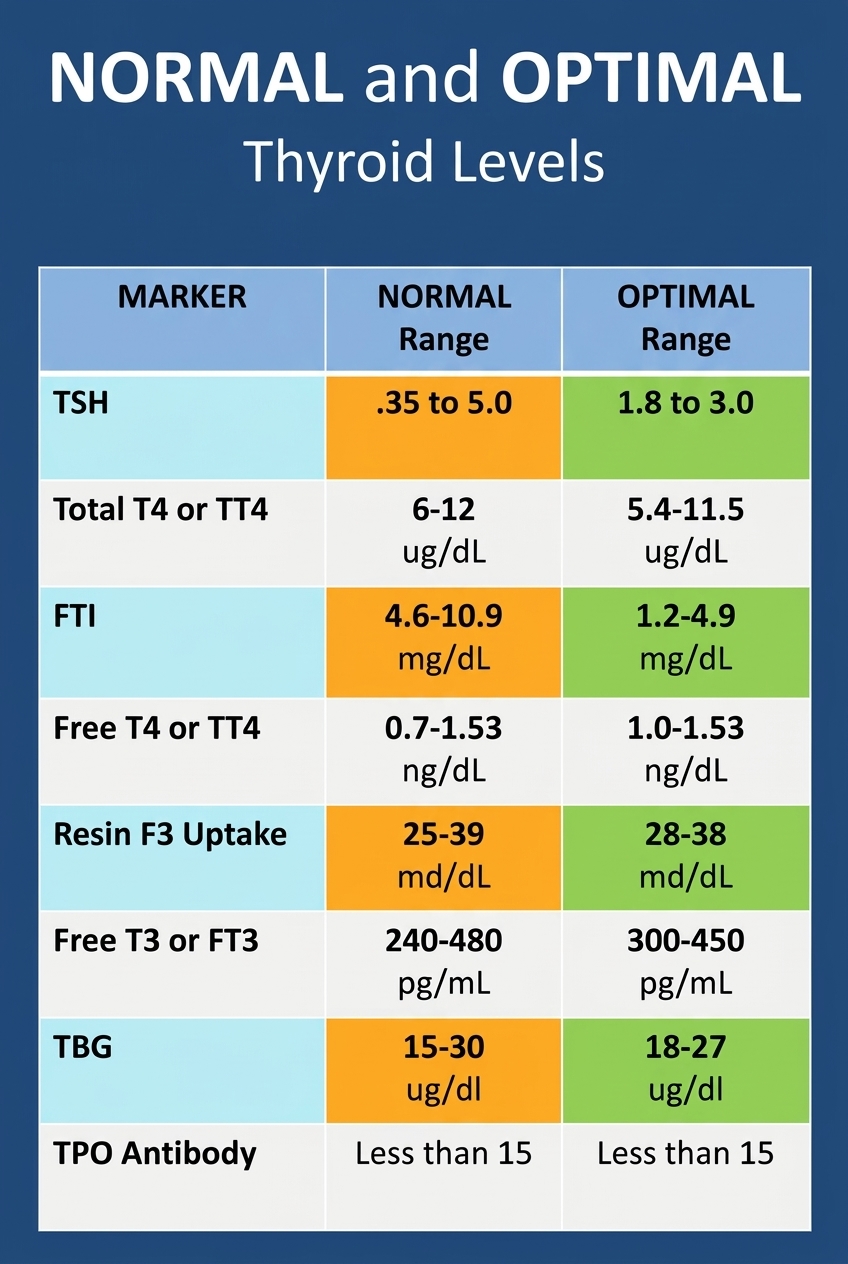
Understanding your thyroid lab results can be confusing, especially when you realize that “normal” and “optimal” levels aren’t always the same thing. This comprehensive reference chart breaks down the standard ranges for key thyroid markers, including TSH, Total T4, Free T4, Free T3, and TBG, while highlighting the narrower, more functional “optimal” ranges often preferred by endocrinologists for peak wellness. For example, while a normal TSH range is broadly accepted as .35 to 5.0, many functional practitioners consider 1.8 to 3.0 to be optimal for metabolic health.
Beyond the basic hormones, this chart includes essential diagnostic markers like the TPO Antibody, which helps identify autoimmune thyroid conditions like Hashimoto’s disease, as well as metrics like Resin F3 Uptake and FTI. Knowing these exact numerical ranges is invaluable for patients reviewing their own blood work and for healthcare students studying for exams. By comparing your lab results against both the standard and optimal columns, you can have more informed, productive conversations with your doctor about your thyroid health and potential treatment plans.
Leave a Reply