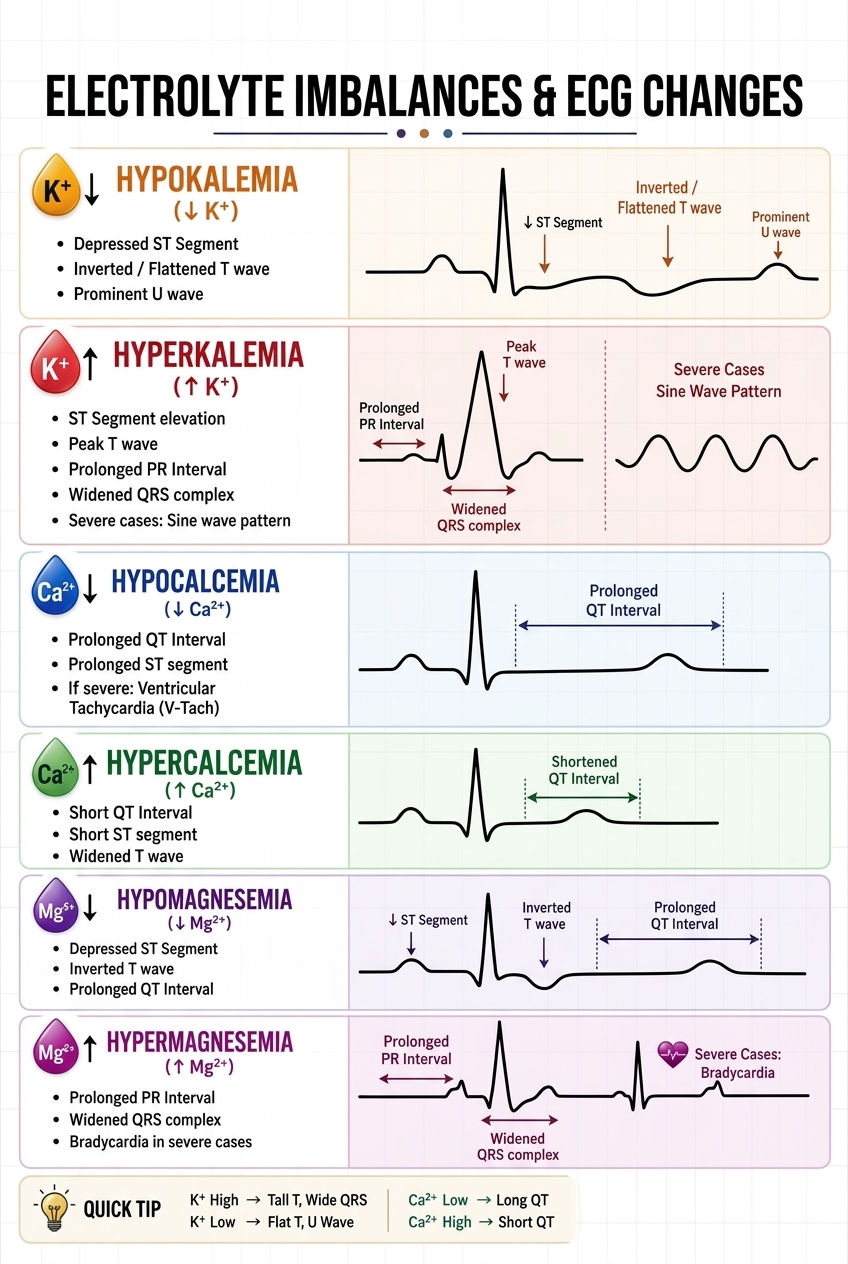
Electrolytes play a fundamental role in cardiac electrophysiology, and even slight imbalances in potassium, calcium, or magnesium can cause distinct, visible changes on an electrocardiogram (ECG). This comprehensive infographic serves as an essential clinical reference, breaking down exactly what to look for when interpreting ECGs for metabolic disturbances. For instance, Hypokalemia is classically marked by a depressed ST segment, flattened or inverted T waves, and a prominent U wave. Conversely, Hyperkalemia—a life-threatening condition—progresses from peaked T waves and a widened QRS complex to the ominous “sine wave” pattern in severe cases.
Beyond potassium, calcium and magnesium levels offer their own unique ECG signatures. Hypocalcemia notably prolongs the QT and ST intervals, whereas Hypercalcemia shortens them. Magnesium imbalances are equally critical, with Hypomagnesemia mirroring hypokalemia (inverted T waves, prolonged QT) and Hypermagnesemia mimicking hyperkalemia (widened QRS, bradycardia) alongside a prolonged PR interval. The quick tip at the bottom provides a fantastic memory aid: K+ High = Tall T, Wide QRS; K+ Low = Flat T, U Wave; Ca2+ Low = Long QT; Ca2+ High = Short QT. Mastering these visual patterns is crucial for rapid clinical intervention and passing nursing or medical board exams.
Leave a Reply